
Population forecasting is very much important to decide the path of growth for a society. If future population is known then it’s easy to design anything as future population.
Population of any community depends upon:
- Growth rate,
- Death Rate,
- Migration Rate
There are various population forecasting methods. Some methods are used when the design period is large and some are used when design period is small. The particular method to be adopted for a particular case or for a particular city depends largely upon the factor discussed in these methods and the selection is left to the discretion and intelligence of the designer.
1. Arithmetic Increase Method
In arithmetic Increase Method, we considered rate of growth of population is constant. Average increasing population over the present population is considered. This method is of limited application, mostly used in large and established towns where future growth has been controlled.
This method is based upon the assumption that the population increase at a constant rate, i.e. the rate of change of population with time is constant.

Here, Pt2 and Pt1 represent the population at time t2 and t1 respectively. This time period is usually reckoned in decades.
K is the rate of population per unit time (decade), thus (t2 – t1) = Number if decades.
The equation can be rewritten as,
Pn = P0 + n.x̅
Where,
Pn = perspective or forecasted population after n decides from the present from the present (i.e. last known census)
P0 = Population at present (i.e. last known census)
n = Number of decades between now and future
x̅ = Average (arithmetic mean) of population increase in known decades
2. Geometric Increase Method
This method of geometric progression is applicable to the cities with unlimited scope for future expansion and where a constant rate of growth is anticipated.
The main difference between arithmetic and geometric increase method of population forecasting is that, in Arithmetic method no compounding is done whereas in Geometric method compounding is done for every decade. That’s why Geometric increase method is also known as uniform increase method.
In this method, a constant value of percentage growth rate per decade (k) analogues to the rate of compounding interest per annual.
Thus, population after one decade can be given by,
P1 = P0 + kP0 = P0 (1+k)
Similarly, population after n decades

Where,
P0 = initial population i.e. at the end of the last known census.
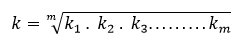
Average percentage growth rate per decade “k” to be used in the above equation is computed from the percentage growth rate of each decade. The value of k can be calculated as
3. Incremental Increase Method
Incremental Increase Method is applicable for cities which are likely to grow progressively on increasing or decreasing rate rather than a constant rate. This method is similar to Arithmetic increase method with some modifications.
According to this method, population after n decades can be given by

Where,
x̅ = average increase or population per decade
y̅ = average incremental increase
Pn = perspective or forecasted population after n decides from the present from the present (i.e. last known census)
P0 = Population at present (i.e. last known census)
n = Number of decades between now and future
4. Decreasing Growth Rate Method
Decreasing Growth rate method is used if population is reaching towards saturation and growth rate is decreasing.
In this method average decrease in the percentage increase is calculated and then subtracted from the last percentage increase computation made for each increased year.
Calculate the percentage increase in population for each decade and work out the decrease in percentage increase in each decade and find average percentage decrease. The population of upcoming decade from the previous known decade is given as
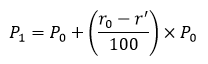
Population after next two decades from the last known decade is given as

Where,
P0 = Population of last known decade
r0 = Growth rate of last decade
r’ = Average decrease in growth rate
NOTE –
- Arithmetic Increase Method gives low results which is suitable for cities growing with slow rate such as old cities.
- Geometric Increase Method gives high result which is suitable for cities growing with fast rate such as new cities.
- Incremental Increase Method gives moderate results which can be used for new and old cities.
- The Government of India (GOI) manual on water and water treatment recommends the use of Geometric Increase Method.
- Decreasing growth rate method is used only in those cases, where the rate of growth shows a downward trend.
5. Graphical Projection or Extension method
In this approach, a graph is plotted between time and population, either on arithmetic paper or on a semi-log paper.
- This time population curve is then smoothly prolonged up to desired year for projecting the future population. The line of best fit may also be by the method of least square.
- If the graph is plotted on semi-log paper with time on arithmetic scale and population on log-scale, the time population curve form a straight line.
- Plotting on simple graph paper give approximate results as the expansion of curve is done by the judgement and skill of designer.
- This method is used when past record is available for long duration and the required data is only for small duration.
6. Comparative Graphical Method
In this method, the cities having the similar condition and characteristics (development activities, migration, death rate, birth rate etc.) are selected which have grown in similar way in the past and their graphs are plotted.
- For population forecasting of a relatively new city, population time curve of cities having similar conditions to the city whose future population is to be estimated, are obtained.
- Based on the comparison of population time curve for comparable cities, the population time curve of the city under consideration is extended from the point of last available data upto the required future data.
7. Master Plan or Zoning Method
In this method, a master plan is developed, which divide the city in different zones of residential, commercial and industrial and the population density is fixed for each zone. In this way when the zone developed in future there is only fixed population density and in this way with the help of number of zones, it is very easy to access precisely the design population.
The density and distribution of population in various zones of the city are to be made with discerning judgement on the relative probabilities of expansion with in zone. This is based on the existing and contemplated town planning regulations, master plans and also according to the nature of development of the region.
8. Ratio Method or Apportionment method
In this approach of population forecasting, population of any town is expressed as a percentage of population of whole country and by taking the average growth rate of the country, population may projected.
A graph is plotted in this method between time and ratio of local population to national population.
9. The Logistic Curve Method
The logistic curve method is suitable for regions where the rate of increase or decrease of population with time and also the population growth is likely to reach an ultimate saturation limit because of special factors.
The growth of a city which follow the logistic curve, will plot as a straight line on the arithmetic paper with time intervals plotted against population in percentage of saturation.